Mrs.D Math · 6th Grade
BAR
CODE
Percent Bar Graphs & Variability · Data
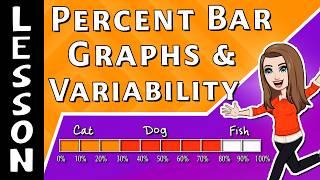
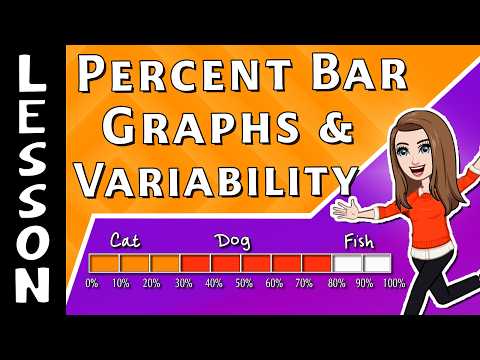
📊 Percent Bar Graph
📈 Variability
⚖️ Compare Graphs
📊 Part ÷ Total × 100
📉 No · Low · High Variability
⚖️ Class A vs Class B
📺 Mrs.D Math Lesson
Watch on YouTube ↗

Made for Mrs.D Math students 🎉