Mrs.D Math · 6th Grade

DATA
DETECTIVE

Data · Part 1
🎯 Center: Mean · Median · Mode
↔️ Spread: Range
📈 Variability
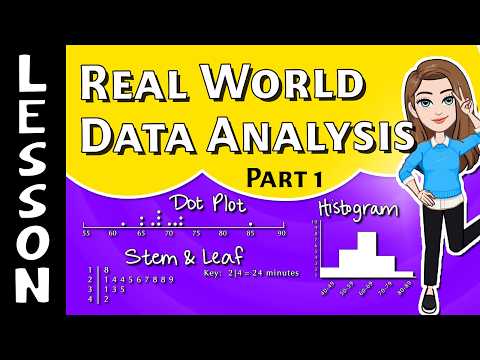
🟢 Dot Plot
🌿 Stem & Leaf Plot
📊 Histogram
📺 Mrs.D Math Lesson
Watch on YouTube
Watch on YouTube ↗
Made for Mrs.D Math students 🎉
🔍 Be a Data Detective

Three Ways to Show Data

🟢
Dot Plot — each dot is ONE data value, stacked above a number line. Count the dots!
🌿
Stem & Leaf Plot — the stem is the tens digit, each leaf is a ones digit. Use the key!
Key: 4 | 7 = 47    so stem 4 with leaves 2 5 7 means 42, 45, 47
📊
Histogram — bars show how many values fall in each INTERVAL. Bars touch, and the height is the frequency.

The Detective Questions

1
Measures of center: Mean = add all, divide by how many. Median = middle value when in order. Mode = most common value.
Data: 2, 3, 3, 4, 8  →  mean 4 · median 3 · mode 3
2
Spread (range): greatest value − least value.
8 − 2 = 6
3
Variability: the more SPREAD OUT the values are, the HIGHER the variability. Values bunched together = LOW variability. All the same = NO variability.
4
Conclusions: read the plot carefully and decide which statement is actually true.

How to Play

✏️
Number answers — type your answer in the box and hit CHECK. Decimals like 7.5 are fine.
👉
Choice answers — tap one of the 4 buttons.
❤️
3 lives, 10 questions. Streaks earn bonus points!
Score
0
Streak ⚡
0
Lives
QUESTION 1 / 10
DOT PLOT
📺 Mrs.D Math Lesson
Watch on YouTube
Watch on YouTube ↗
🎉
MEDIUM
CHAMPION!
You nailed it!

Your Results

0
points
0
Correct
0
Wrong
0
Best Streak
Made for Mrs.D Math students 🎉
📋 Review Answers
MEDIUM
0 correct · 0 wrong · 0 points
Made for Mrs.D Math students 🎉