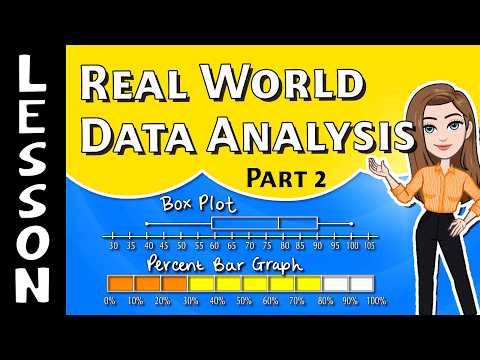
📚 Box Plots & Percent Bar Graphs
Reading a Box Plot
A box plot shows the five-number summary: minimum, Q1, median, Q3, and maximum.
●
The dots at each end are the minimum and maximum.
▮
The box runs from Q1 (left edge) to Q3 (right edge). The line inside is the median.
25%
Each of the four sections holds about
25% of the data.
below Q1 = 25% | inside the box = 50% | below the median = 50%
−
Range = maximum − minimum
IQR = Q3 − Q1
A longer box or longer whiskers = more spread out
Reading a Percent Bar Graph
One bar runs from 0% to 100% and is split into sections — one per choice.
1
Use the frequency table:
percent = frequency ÷ total × 10012 out of 40 → 12 ÷ 40 = 0.30 → 30%
2
Going backwards?
Multiply the percent by the total.
25% of 60 → 0.25 × 60 = 15 students
3
All the sections together must add to 100%.
What Is Variability?
Variability tells you how spread out the data is. The more spread out the numbers, the higher the variability.
📦
Box plots: a wider box and longer whiskers mean a bigger range and IQR → more variability.
📈
Percent bars: compare the percents.
100% one choice = NO variability
30%, 35%, 35% = LOW variability
75%, 20%, 5% = HIGH variability
How to Play
📦
Box Plots — read the five-number summary, range, IQR, and percents.
📈
Percent Bar Graphs — use the table and the bar to find percents and counts.
🎉
Mixed — both kinds together. 10 questions, 3 lives. Build a streak for bonus points!