Mrs.D Math · 6th Grade
WHISKER
WARS
Data · Box Plots & Measures of Spread
📦 Box Plots
✂️ Quartiles
⬇️ Minimum
⬆️ Maximum
📦 Box = Middle 50%
📏 Range = Max − Min
🎯 IQR = Q3 − Q1
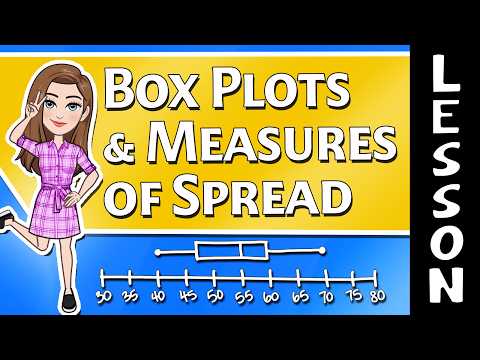
📺 Mrs.D Math Lesson
Watch on YouTube ↗

Made for Mrs.D Math students 🎉